DataScience@SMU Student Graphs Conversations, TV Scripts and More Using NLP and Data Visualization
Data scientists are often tasked with coming up with cross-disciplined, scalable, data-driven solutions to problems. When Gavin Hudgeons, a student in the machine learning track at the DataScience@SMU program, saw the complexity involved in tracking speakers and topics in public meetings, he leveraged his experience from the program to create a tool to help navigate these discussions.
His solution, Quazer Graphs, marries natural language processing and data visualization to literally draw the lines connecting everything within a given conversation, speech or even movie script.
The Problem
Hudgeons runs his own company, g60Vision, and consults with clients mostly in the earth science discipline: oil and gas, environmental engineering, waste management, etc. For his work, Hudgeons typically relies on his geology and geospatial data background.
One of his industrial clients in Texas has to regularly address concerned citizens about their facilities in their neighborhoods during local city council meetings. While attending a few meetings, Hudgeons noticed a trend.
“I listened to what citizens were saying, the complaints that they were having, and their testimonies. And then I listened to the response from the representative of the company,” he said. “And I was like, you know, that response is not very good. They didn’t really address what the citizens were saying.”
There was a disconnect between the company and the citizens in the neighborhood. And the solution was already in the transcripts from the council meetings.
The Solution: Graphing Out the Conversations
Hudgeons started to map out the social networks during the meeting for his clients: the topics discussed and the relationships between players. His first attempts were by hand, writing out key phrases and sentences between nodes. Right away, he recognized that these graphs “get very complex, very fast.”
He was already in the mindset of using programming to visualize data, stating that one of his motivations for joining the DataScience@SMU program was to “brush up on [his] programming chops” in this space. Hudgeons leveraged his natural language processing skills to help map out these conversations and then treated it as a coding exercise, working through the logic of how he would parse out these unstructured text files into a format that he could graph.
“I started writing code [that] would take transcripts and would process them to pick out the speakers and what they said,” explained Hudgeons. Using techniques like named entity recognition, his code pulls out important topics and people from those conversations and maps them as nodes with connection.
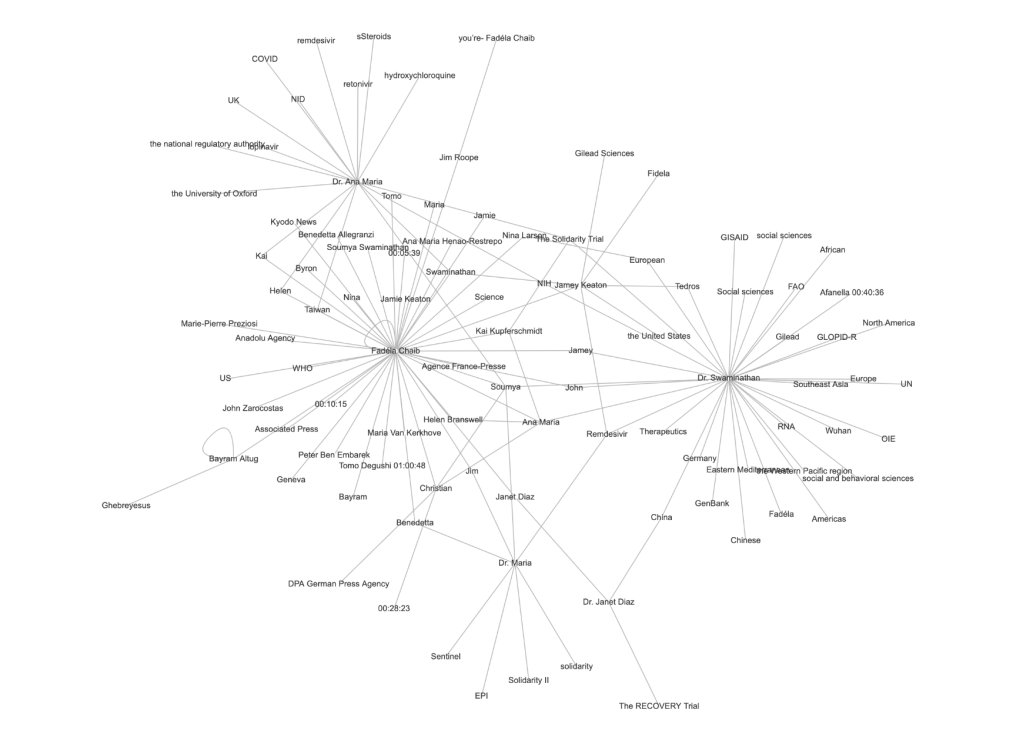
The result is a graph with interactive connections, in which a person reviewing the transcript can easily scan the graph for key speakers and topics. Clicking on one of the lines pulls up the conversation that established that connection. The most recent versions of his program also run sentiment analyses on each conversation. The client was now able to understand and break down conversations using transcriptions converted into these graphs.
The scalability was immediately clear to Hudgeons.
“I can run 10 meetings or 10,000 meetings a day now,” he said. The code is lightweight enough to run on a laptop and convert transcripts rather quickly.
It can also combine meetings, graphing out connections over different conversations and consolidating them into one graph.
Hudgeons is now exploring what his graphs can do on his website, where he continues to map out council meetings and discussions. For example, he’s been using the graphs to understand COVID-19 coverage better – long with pop culture topics, such as Shakespeare and the entire series of Seinfeld. He also posts daily graphs of current events on his Twitter feed.
You can find updates to his work at QuazerGraphs.com and follow daily graphs Twitter.com/quazergraphs.
Citation for this content: DataScience@SMU’s online master’s in data science program
Last updated September 2020