


Alternatives to Silicon Valley Surprise Data Scientists
When people think of data science they correctly associate it with big data and usually think of Silicon Valley. But the alternatives to “The Valley” are surprising, and trends in this field (like many others) are skewing to disruption. Smart students and motivated professionals of all ages are finding that earning a master’s degree in data science allows them to transition into a new field, or grow in their current one, in many different parts of the United States.
In fact, a person with a Master of Science in Data Science can work in almost any corporate or government setting in a wide range of industries and in a variety of places that might be considered atypical.
Professionals with data science degrees can launch their own consulting businesses or take their degrees outside of normal channels altogether. The executive recruiting firm Burtch Works reports disruptive trends in the ranks of data scientists. As an example, some master’s degree holders in this discipline are shying away from FANG (Facebook, Amazon, Netflix and Google) and are moving toward other areas such as cancer research or energy conservation.
Meanwhile, the push to stay one step ahead in the business world is forcing corporate HR teams to seek candidates with diverse backgrounds to ensure they are getting the most out of big data.
Where’s the Best Place to Live?
It depends on what you want. The demand for data scientists is high almost anywhere and in almost any industry. The data below can help determine which city is best for you.
U.S. Tech Hub Cities
- Austin
- Boston
- Denver
- New York
- Raleigh-Durham
- San Francisco
- Seattle
- Washington, D.C.
The best place to live depends on who you are and what you’re looking for. Here are some highlights from our findings:
If you want to find a corporate job:
- Highest number of companies: New York
- Lowest number of companies: Raleigh-Durham
- Highest number of job postings: Raleigh-Durham
- Lowest number of job postings: New York
If you’d like to start your own company:
- Highest office rental $/ft2: New York
- Lowest office rental $/ft2: Seattle
- Highest in available office space: New York
- Lowest in available office space: Raleigh-Durham
If you have a family:
- Highest cost of living: San Francisco
- Lowest cost of living: Raleigh-Durham
- Highest job growth rate: San Francisco
- Lowest job growth rate: Washington, D.C.
If income is a priority:
- Highest per capita income: San Francisco
- Lowest per capita income: Raleigh-Durham
Now that today’s data scientists know they have more geographical choices, they will apply their analyses to the infographic, knowing full well that these data are just a starting point. Competing goals clash: High incomes are offset by high costs of living; a city rich in office space may also have the highest cost per square foot.
Professionals with a master’s degree in data science can work in almost any industry — imagination being the only limiting factor — and those industries exist in U.S. cities that are not considered traditional tech hubs. Today’s data scientists, with their wonderfully diverse undergraduate degrees and work experience, will forge new paths and help decision-makers within, and outside of, the strict confines of corporate America.
The infographic operates as data science does: by synthesizing big data and then allowing others to make decisions from it — both big and small.
-
The Ultimate Guide to Comparing U.S. Tech Hubs
Silicon Valley Isn’t the Only Option
Cost of Living: Percent above the national average. (Most recent data from 2015.)
- Austin: 10.90%
- Boston: 18.40%
- Denver: 6.70%
- New York: 23.30%
- Raleigh-Durham: 0.70%
- San Francisco: 50.50%
- Seattle: 21.30%
- Washington, D.C.: 24.60%
Job Postings: per 1,000 people. (Most recent data from 2016.)
- Austin: 44
- Boston: 40
- Denver: 54
- New York: 26
- Raleigh-Durham: 56
- San Francisco: 38
- Seattle: 46
- Washington, D.C.: 38
Per Capita Annual Income: (Most recent data from 2014.)
- Austin: $32,672
- Boston: $34,770
- Denver: $34,423
- New York: $32,459
- Raleigh-Durham: $30,110
- San Francisco: $49,986
- Seattle: $44,167
- Washington, D.C.: $46,502
Job Growth Rate: (Most recent data from 2014.)
- Austin: 4.2%
- Boston: 1.8%
- Denver: 3.7%
- New York: 2.40%
- Raleigh-Durham: 2.95%
- San Francisco: 4.6%
- Seattle: 3%
- Washington, D.C.: 0.6%
Unemployment Rate: (Most recent data from 2015.)
- Austin: 3.5%
- Boston: 4.60%
- Denver: 3.80%
- New York: 6.10%
- Raleigh-Durham: 4.30%
- San Francisco: 3.50%
- Seattle: 4.40%
- Washington, D.C.: 4.70%
Median 1-Bedroom Rent: Monthly USD. (Most recent data from 2016.)
- Austin: $1,200
- Boston: $2,500
- Denver: $1,340
- New York: $3,500
- Raleigh-Durham: $900
- San Francisco: $3,460
- Seattle: $1,730
- Washington, D.C.: $2,170
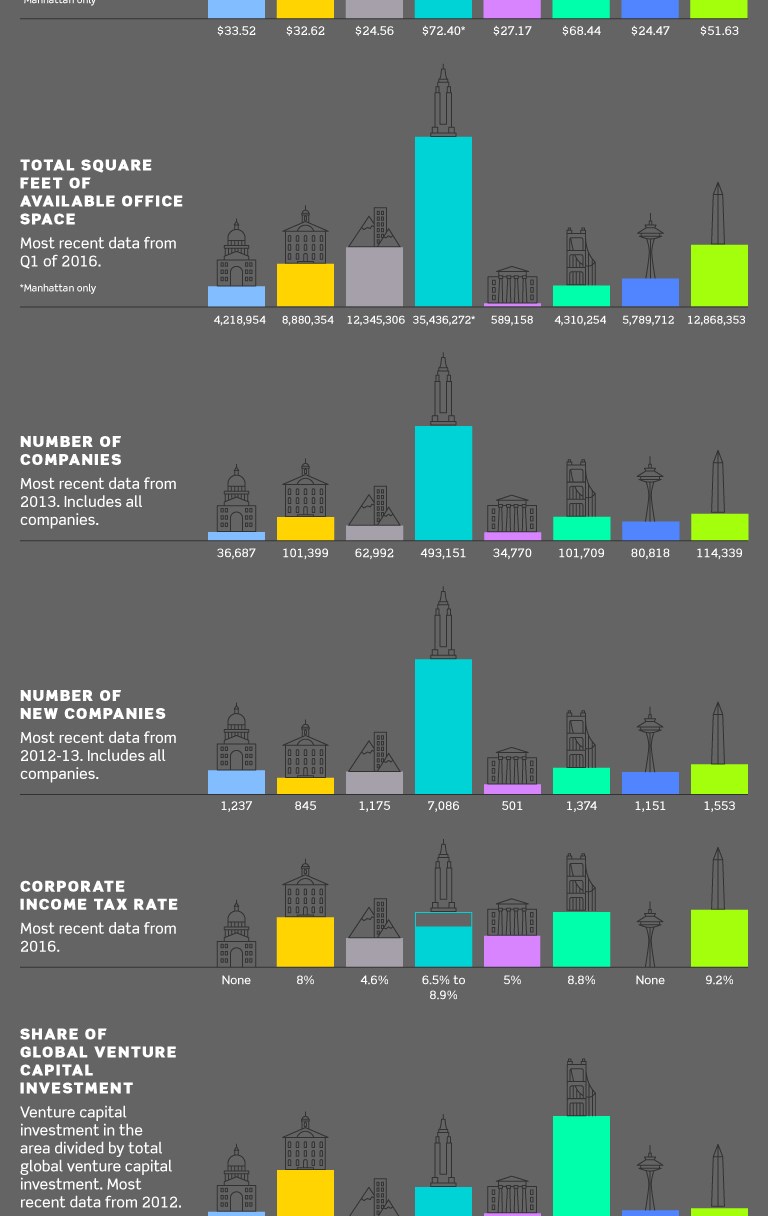
Office Rentals USD: per square foot per month. (Most recent data from Q1 of 2016.)
- Austin: $33.52
- Boston: $32.62
- Denver: $24.56
- New York: $72.40*
- Raleigh-Durham: $27.17
- San Francisco: $68.44
- Seattle: $24.47
- Washington, D.C.: $51.63
Total Square Feet of Available Space: (Most recent data from Q1 of 2016.)
- Austin: 4,218,954
- Boston: 8,880,354
- Denver: 12,345,306
- New York: 35,436,272*
- Raleigh-Durham: 589,158
- San Francisco: 4,310,254
- Seattle: 5,789,712
- Washington, D.C.: 12,868,353
Number of Companies: (Most recent data from 2013. Includes all companies.)
- Austin: 36,687
- Boston: 101,399
- Denver: 62,992
- New York: 493,151
- Raleigh-Durham: 34,770
- San Francisco: 101,709
- Seattle: 80,818
- Washington, D.C.: 114,339
Number of New Companies: (Most recent data from 2012-13. Includes all companies.)
- Austin: 1,237
- Boston: 845
- Denver: 1,175
- New York: 7,086
- Raleigh-Durham: 501
- San Francisco: 1,374
- Seattle: 1,151
- Washington, D.C.: 1,553
Corporate Income Tax Rate: (Most recent data from 2016.)
- Austin: None
- Boston: 8%
- Denver: 4.63%
- New York: 6.5% to 8.5%
- Raleigh-Durham: 5%
- San Francisco: 8.84%
- Seattle: None
- Washington, D.C.: 9.20%
Share of Global Venture Capital Investment: Venture capital investment in the area divided by total global venture capital investment. (Most recent data from 2012.)
- Austin: 1.50%
- Boston: 7.40%
- Denver: 0.58%
- New York: 5%
- Raleigh-Durham: 1.30%
- San Francisco: 15%
- Seattle: 1.70%
- Washington, D.C.: 2%
Net Migration: The difference of immigrants and emigrants of an area in a period of time. (Most recent data from 2015.)
- Austin: (+) 9,570
- Boston: (+) 1,360
- Denver: (+) 8,390
- New York: (-) 5,310
- Raleigh-Durham: (+) 5,200
- San Francisco: (+) 2,690
- Seattle: (+) 6120
- Washington, D.C.: (+) 890
Crimes: per 100,000 people. (Most recent data from 2015.)
- Austin: 3,724
- Boston: 2,676
- Denver: 3,084
- New York: 2,227
- Raleigh-Durham: 3,293
- San Francisco: 3,996
- Seattle: 4,068
- Washington, D.C.: 2,800
Science and Engineering Degrees: Number of residents who hold science and engineering degrees. (Most recent data from 2014.)
- Austin: 131,682
- Boston: 99,661
- Denver: 96,722
- New York: 908,311
- Raleigh-Durham: 101,926
- San Francisco: 184,478
- Seattle: 154,630
- Washington, D.C.: 136,264
Higher Education: Percent of population with a bachelor’s degree or higher. (Most recent data from 2014.)
- Austin: 41.50%
- Boston: 43.30%
- Denver: 40.30%
- New York: 37%
- Raleigh-Durham: 44.60%
- San Francisco: 49.90%
- Seattle: 43.40%
- Washington, D.C.: 47.30%
Walk Score: A number between 0 and 100 that measures the walkability of any address.
- Austin: 39
- Boston: 81
- Denver: 60
- New York: 89
- Raleigh-Durham: 29
- San Francisco: 86
- Seattle: 73
- Washington, D.C.: 77
Transit Score: A patented measure of how well a location is served by public transit.
- Austin: 34
- Boston: 74
- Denver: 47
- New York: 84
- Raleigh-Durham: 25
- San Francisco: 80
- Seattle: 57
- Washington, D.C.: 71
Bike Score: Measures whether an area is good for biking.
- Austin: 52
- Boston: 70
- Denver: 71
- New York: 65
- Raleigh-Durham: 40
- San Francisco: 75
- Seattle: 63
- Washington, D.C.: 69
Average Commute in Minutes: (Most recent data from 2015.)
- Austin: 26
- Boston: 32
- Denver: 27
- New York: 37
- Raleigh-Durham: 25
- San Francisco: 30
- Seattle: 28
- Washington, D.C.: 34
Sources:
- www.walkscore.com
- www.forbes.com/places
- www.forbes.com/best-places-forbusiness
- www.indeed.com/jobtrends/ percapita
- www.baruch.cuny.edu/nycdata/ income-taxes/per_cap.htm
- www.apartmentlist.com/ rentonomics/national-rent-data
- www.cushmanwakefield.com/en/ research-and-insight
- www.colliers.com/-/media/files/marketresearch/unitedstates/2016-researchreports/1q_usoffice_rport_ d6.pdf?submissionGuid= a7988ce6-6a20-421c-8970- 2a8e2fa4245d
- martinprosperity.org/media/Riseof-the-Global-Startup-City.pdf
- martinprosperity.org/media/ Startup-US-2016_Spiky-VentureCapital_Revised.pdf
- www.census.gov//econ/susb/ data/susb2012.html
- www.census.gov/econ/susb www.mass.gov/dor/all-taxes/taxrate-table.html#return5
- www.metrodenver.org/dobusiness/taxes/corporate
- www1.nyc.gov/assets/finance/ downloads/pdf/15pdf/corporatetax-reform.pdf
- www.dor.state.nc.us/taxes/ corporate/rate.html
- www.dor.state.nc.us/taxes/ corporate/rate.html
- www.tax-rates.org/california/ corporate-income-tax
- cfo.dc.gov/node/232942http://cfo.dc.gov/node/232942
- factfinder.census.gov/faces/ nav/jsf/pages/searchresults. xhtml?refresh=t#none
SHARE ON: FACEBOOK | TWITTER | LINKEDIN
Last updated October 2016